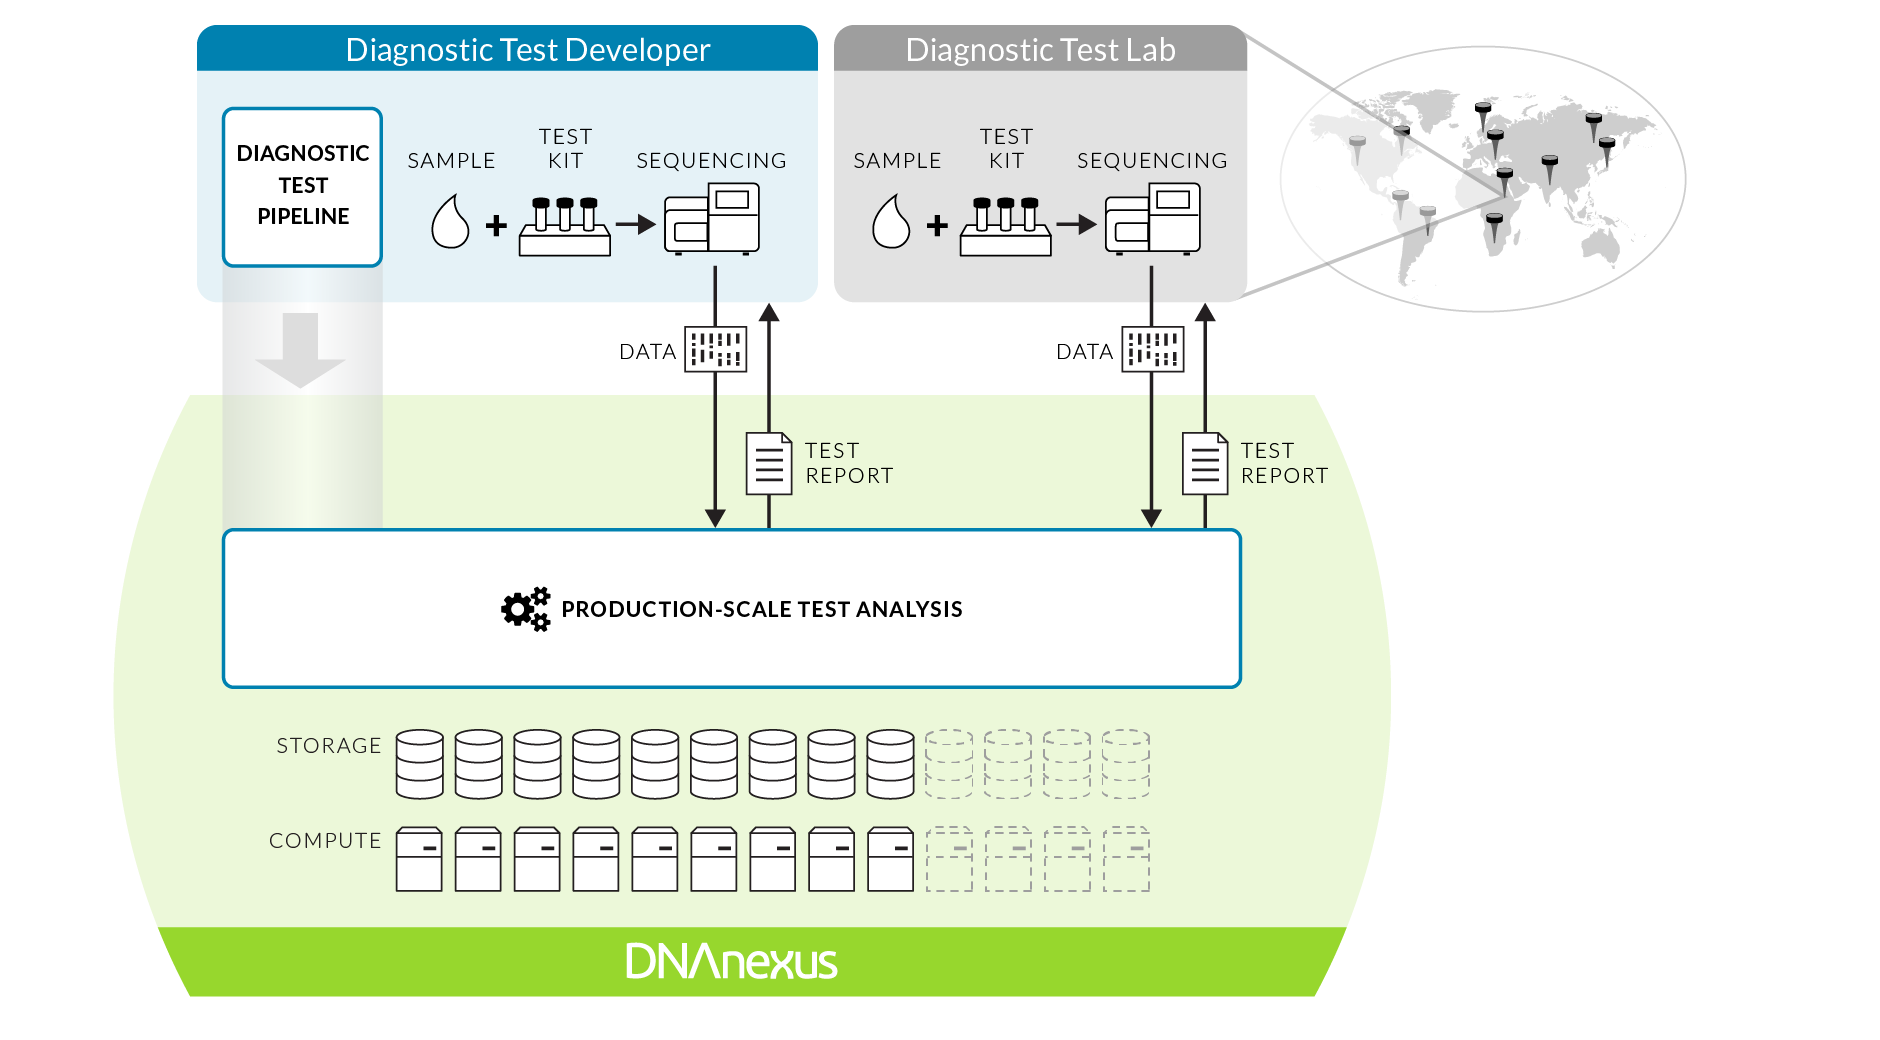
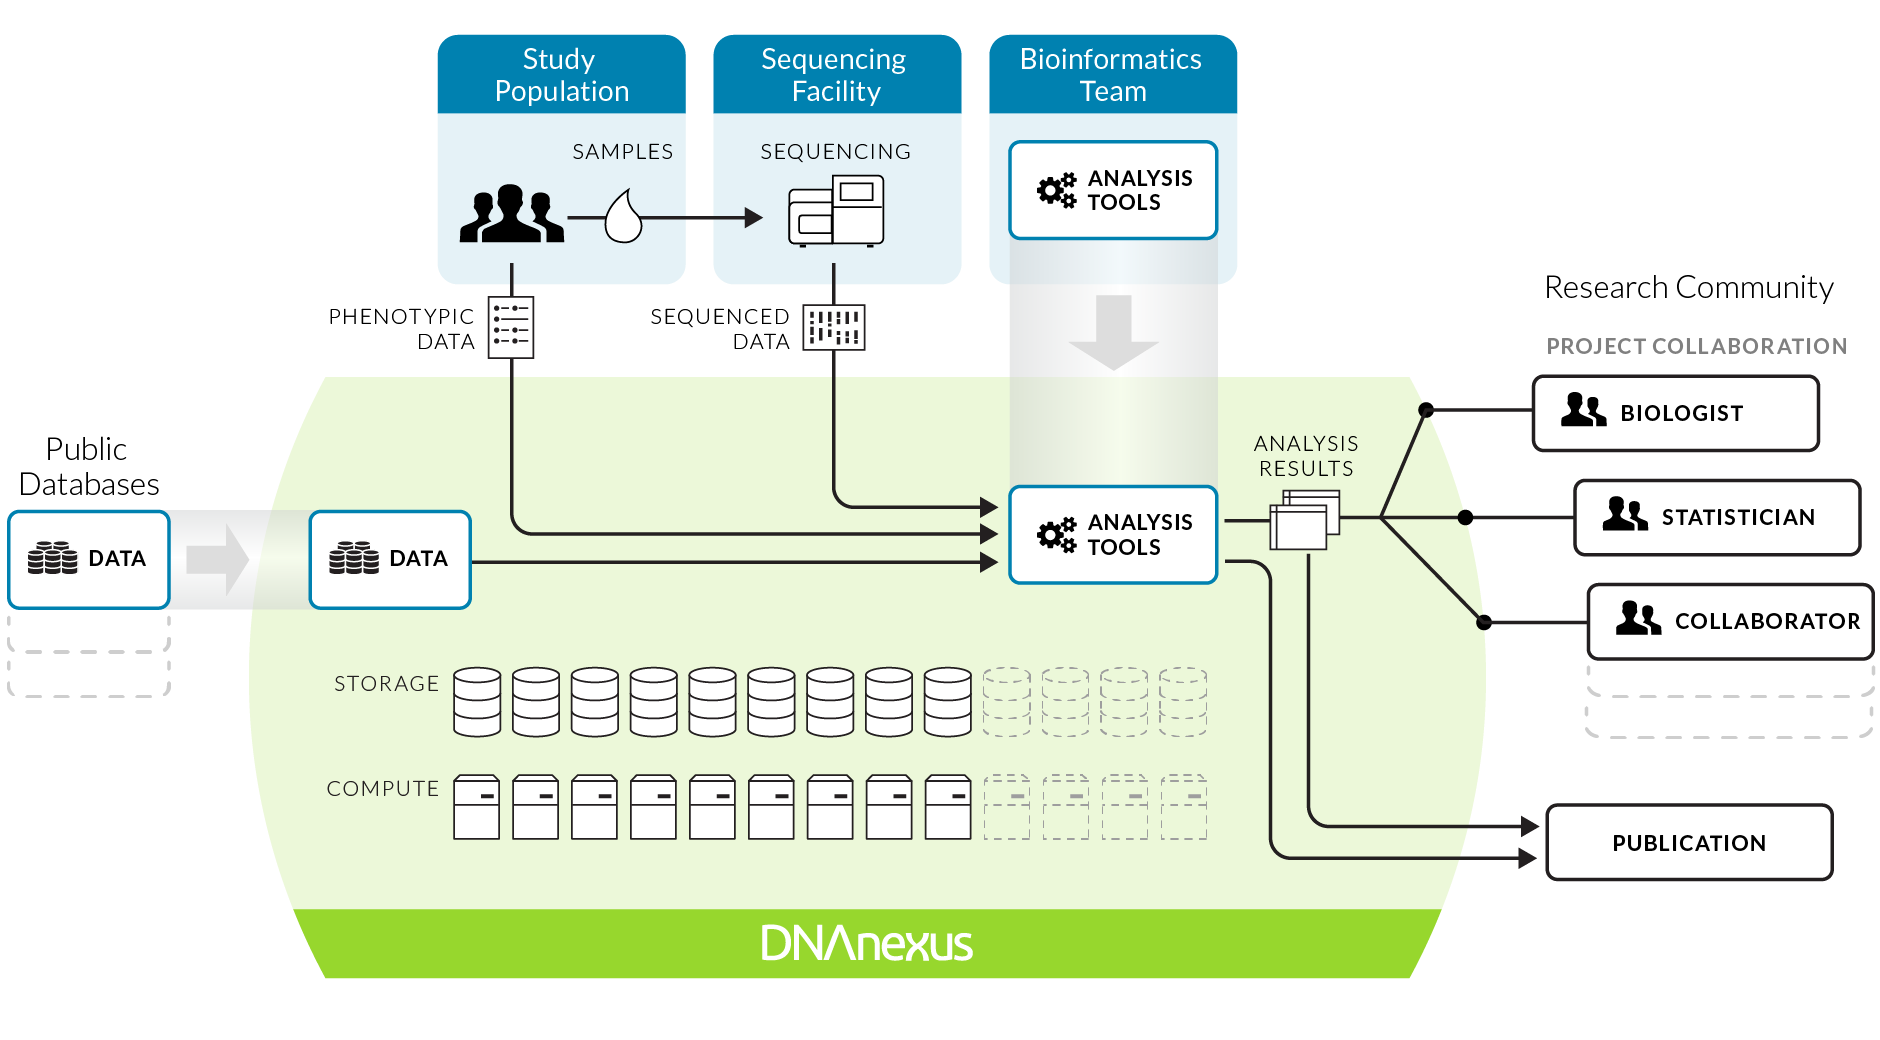
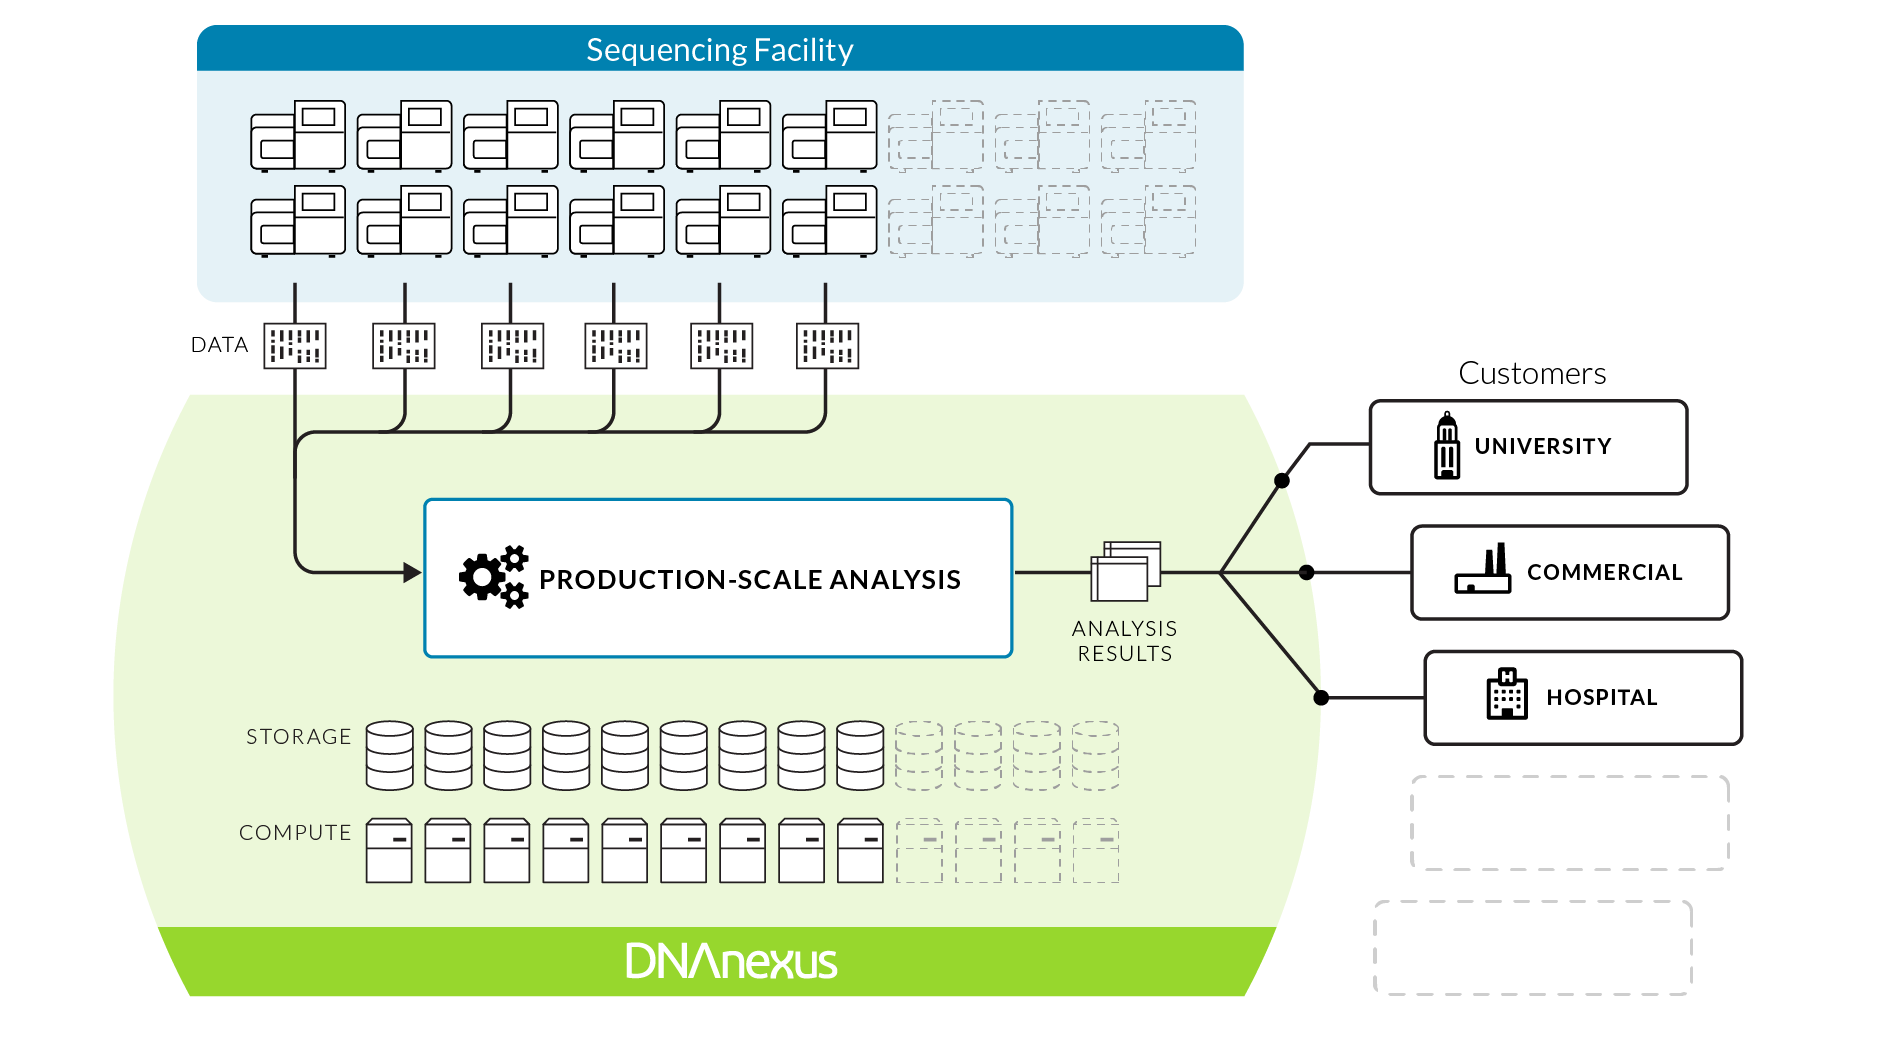
A provider of a cloud-based platform for genome informatics and data management asked for help with visual explanations of their system. The result was a series of related diagrams explaining the platform from the perspective of different potential users.