Diving into Shareholder Behavior
Fenwick & West takes an annual deep look at shareholder behavior related to proxy votes for public companies with a particular interest in how Silicon Valley companies compare to the rest of the country. We handle all the data visualization for the reports.

In addition to the usual area charts, line plots, histograms, and column charts, we have introduced some other ways of looking at the data to aid with the comparison of Silicon Valley companies against their national peers, and to track changes over time.
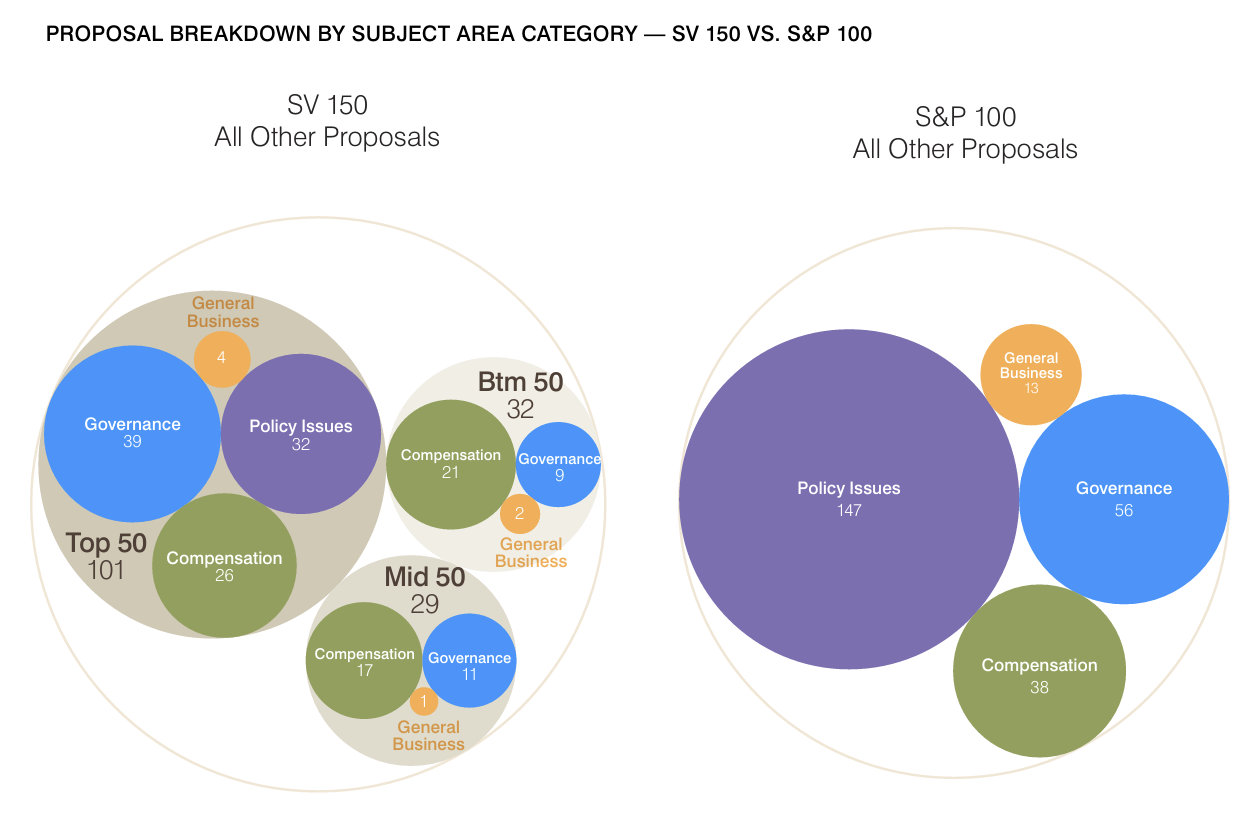
Circle Packing Diagrams
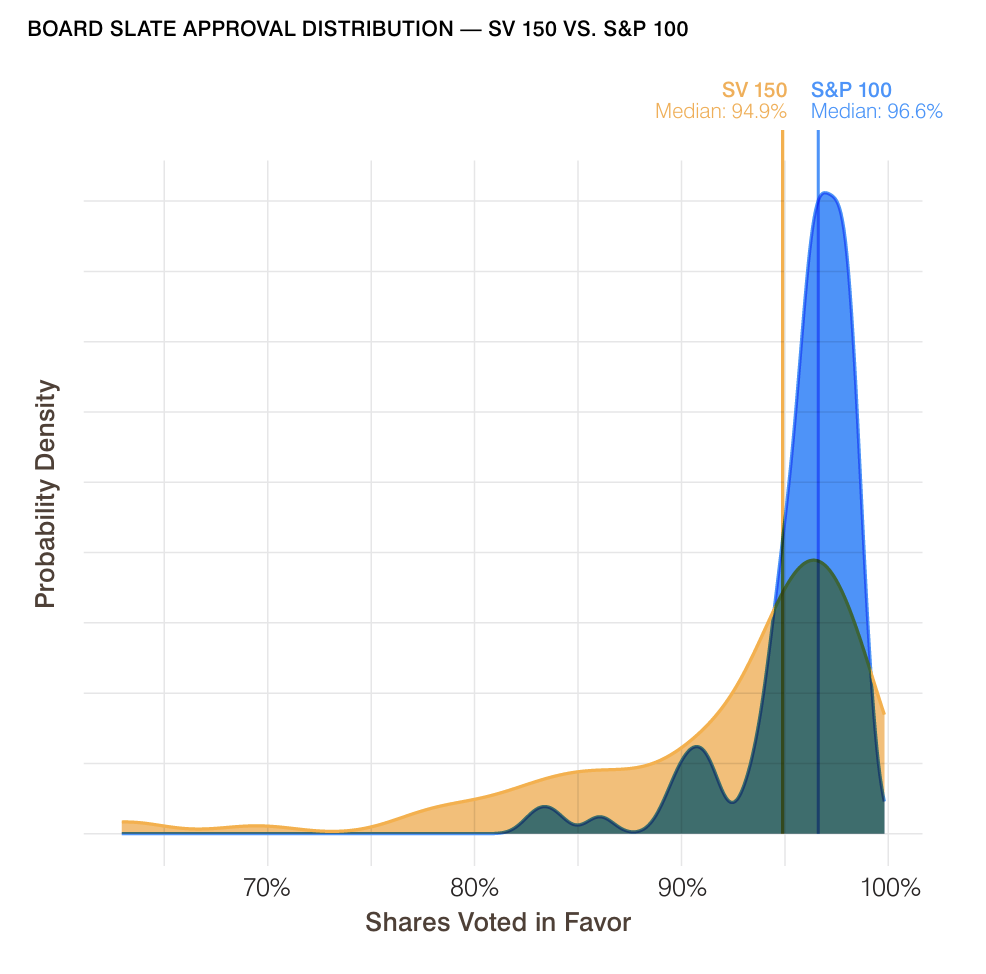
Probability Density Plots
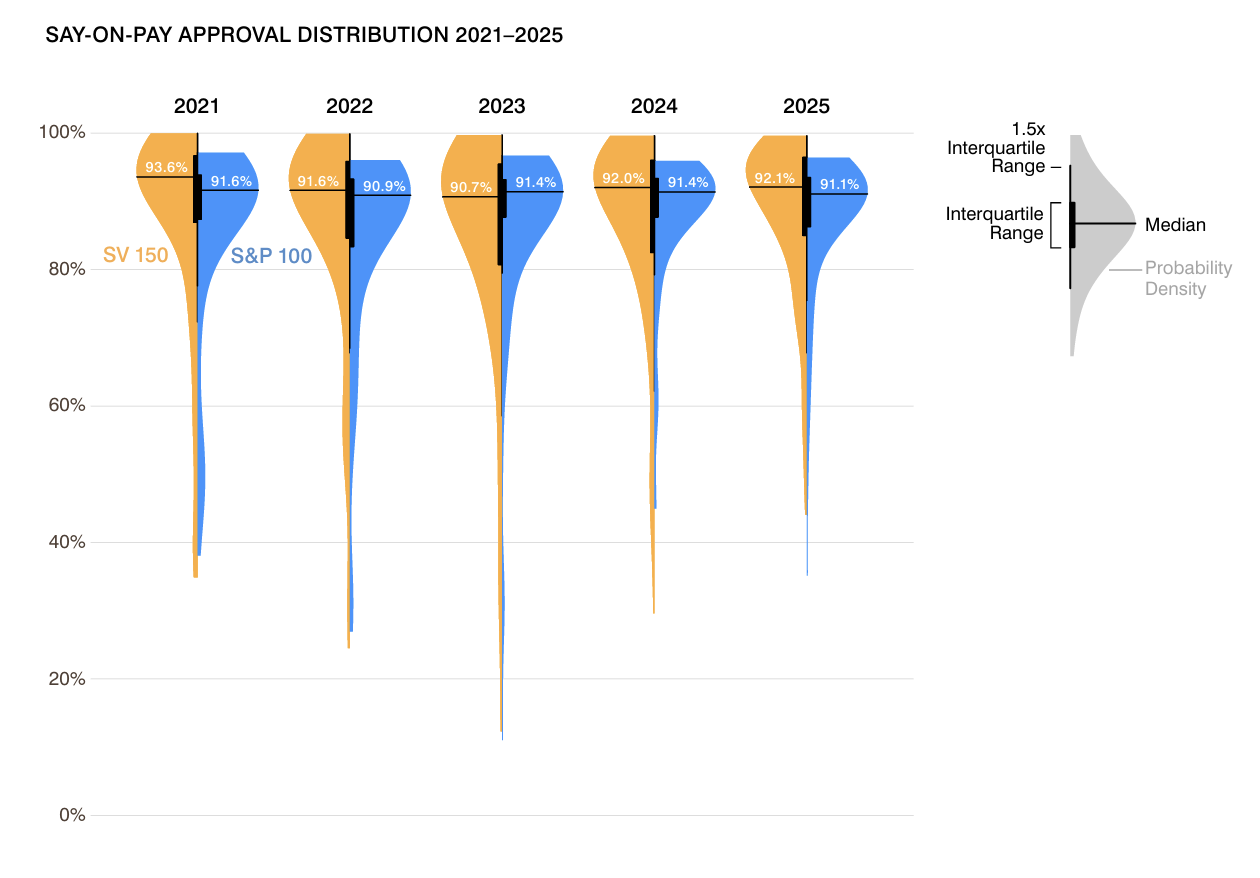
Split Violin Plots
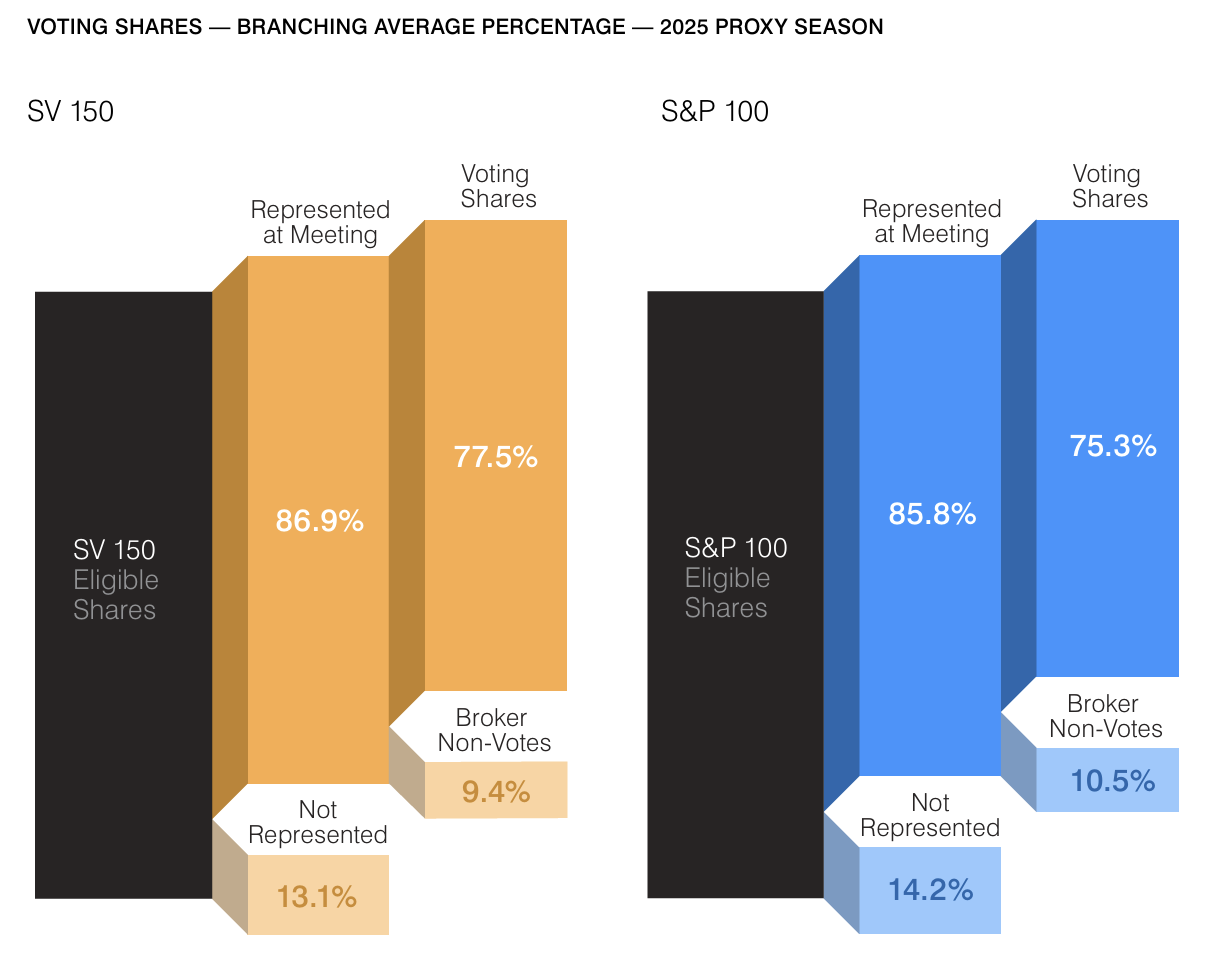
Sankey-Like Branching Diagram