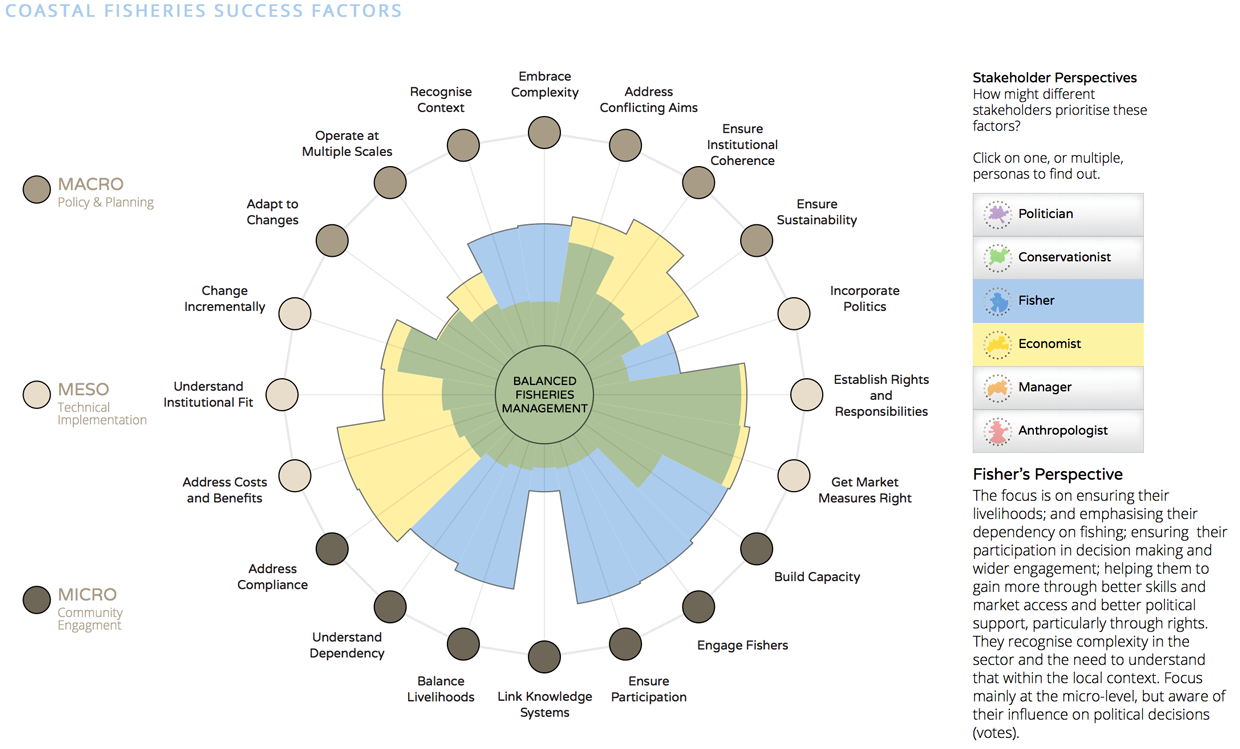
Small-scale coastal fisheries in developing countries have to balance a number of factors (twenty, to be precise) on different levels to be successful. In collaboration with The Foundation Center (now, Candid) and with funding from the Rockefeller Foundation, we undertook to present an interactive visual representation of these twenty success factors, gleaned from a synthesis of available literature on the topic.
We ended up using a coxcomb chart (or polar area diagram or rose diagram) as the base for an interactive presentation built on raphael.js. The interaction allows you to visualize how different stakeholders might prioritize the twenty factors, as well as drill down to get more detail about each factor.
The coxcomb overlays are effective at showing where there might be gaps in perspective that would encourage bringing another stakeholder to the table. There is a lot to keep tabs on when you are managing a fishery. The visualization is no longer live, but you can see a version of it with an assist from The Wayback Machine