Methodology behind Wired Tech Diversity article
I authored a short article for Wired magazine based on the exploration of tech workforce diversity that I originally posted here on this blog. Here, I outline the methodology used for the analysis of the diversity of the tech workforce pipeline.
Objectives
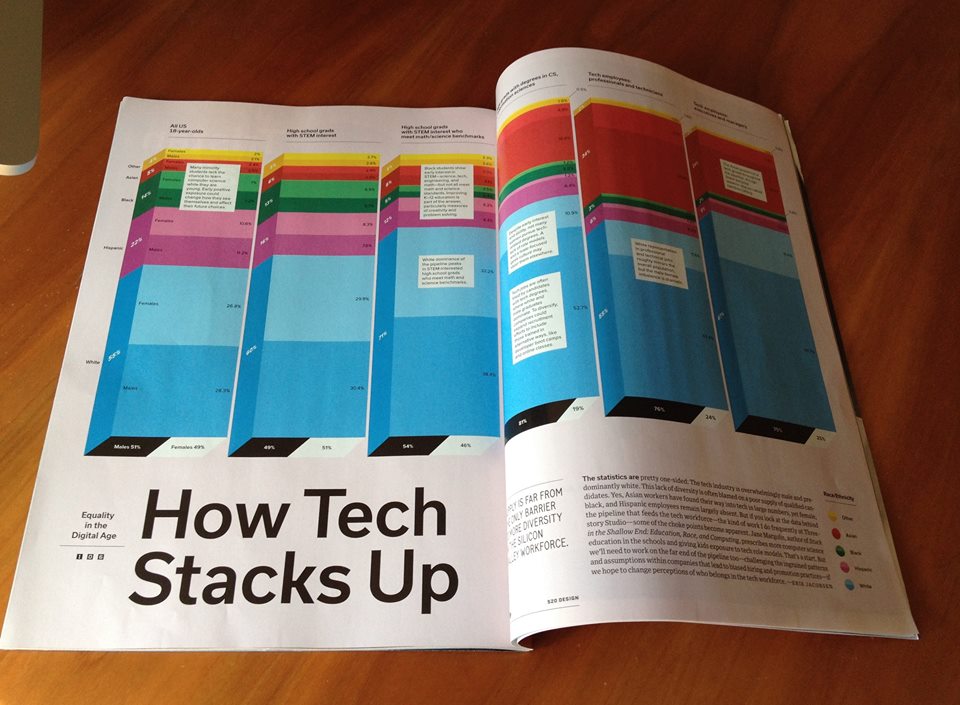
My aim was to find data that could serve as reasonable proxies for the different steps in the pipeline leading to employment in the tech industry, in order to be able to identify bottlenecks. The driving question behind this was: Where along the way from young adulthood to tech industry employment does the racial and gender balance shift?
That led me to look at these data snapshots:
1. All U.S. 18 year-olds
What’s the baseline of race/ethnicity distribution?
2. High school graduates interested in STEM (science, technology, engineering, mathematics) subjects
How does interest in technology-related subjects differ from the baseline?
3. High school graduates interested in STEM and proficient in math and science
Which of those who are interested are also prepared?
4. College degrees earned (bachelors, masters and PhD) in Computer Science, Computer Engineering or Information
In what proportions are high school graduates who are interested and prepared going on to earn degrees that might lead them to tech industry employment?
5. Tech employees: professionals & technicians
Who gets employed by tech companies in technical roles?
6. Tech employees: executives & managers
Which employees get promoted and become leaders?
Some notes on the data
Perhaps most important to note is that each of these steps is just a snapshot look through a fairly narrow window (roughly the middle of 2014). This is not a longitudinal study tracking one cohort of the population moving through a clear pipeline. It is not the actual people we are tracking, but the shifts in racial distribution at each step in the pipeline. Another important note is that this is not a closed pipeline - many people enter the tech industry without college degrees and from other countries. There may be others who have little STEM interest as they graduate from high school, but find that passion later in life. In other words, this is by no means a complete look at where the tech workforce actually comes from. That said, these proxies do provide clues as to where we might look to try to open up the bottlenecks for particular groups at particular steps along the way.
Racial identity & Hispanic origin
Racial identity is not easily classifiable and organizations have struggled with how to track race and ethnicity for a long time. For an interesting discussion of the topic from the Census point of view, see Ben Cassellman’s article at fivethirtyeight.com
For the Census, and for the other data sources used for this analysis, Hispanic origin is considered an ethnicity separate from race. In surveys, people are generally counted as being of Hispanic origin and as being of one or more races. To calculate the race/ethnicity breakdown at each step, I first totaled all people who indicated Hispanic origin, removed them from the remaining pool of people, and then tallied the other racial identities. That means that none of those represented as Black in the chart, for example, are of Hispanic origin.
There are some minor inconsistencies in how race/ethnicity data was collected from one step in the pipeline to another (some included options for “Other” or “race not stated”, and others didn’t, for example), but those discrepancies don't materially affect the numbers that we are examining here. In the graphic, "Other" includes American Indian, Alaska Native, Native Hawaiian, Other Pacific Islander, and Two or More Races.
All U.S. 18 year-olds
For this, I used U.S. Census data, looking at July 1, 2014 estimates of all 18 year-olds broken down by race/ethnicity and sex. Data and links to Census bureau methodologies
The Census dataset used:
PEPALL6N-Geography-United States
Year-July 1, 2014
Annual Estimates of the Resident Population by Sex, Single Year of Age, Race, and Hispanic Origin for the United States: April 1, 2010 to July 1, 2014
High school graduates interested in STEM subjects
Data on high school graduate interest levels in STEM (science, technology, engineering, mathematics) comes from the company that administers the ACT test. The latest data is from 2014 graduates and is broken down by ethnicity and gender. The numbers included here are for students with expressed interest in STEM or measured interest or both. Expressed interest means the student indicated that they planned on a STEM major or occupation following high school. Measured interest is based on student responses to an Interest Inventory. To be counted as meeting benchmarks, students had to score a 22 or higher for the Math benchmark and a 23 or higher for Science. Some have argued that the benchmarks themselves are biased and miss other skills that can make a difference in college or career success, like creativity or problem solving. ACT is already working at broadening the definition. See recent research reports on the subject
An explanation of the current benchmarks: College Readiness Benchmarks
For ACT’s report on this data, including some discussion of the methodologies, see “The Condition of STEM 2014”
College degrees earned
Data on graduates with college degrees (bachelors, masters, PhD) in Computer Science, Computer Engineering, or Information comes from the 2014 Taulbee Survey done by the Computing Research Association. Information degrees include Information Science, Information Systems, Information Technology, Informatics and related disciplines. I have not included the numbers of degree earners for non-resident aliens in these totals. The prior three steps in the pipeline are all based on U.S. residents, and the Taulbee survey data for non-resident aliens is not broken down by race/ethnicity. Also not included are degrees for people where the gender was not reported.
Resources for the Taulbee Survey.
Tech employees
Tech workforce numbers by race/ethnicity and gender come from EEO-1 forms filed by the 11 major tech companies included in the sample (Amazon, Apple, Cisco, Facebook, Google, Intel, LinkedIn, Microsoft, Twitter, Yahoo, Yelp). All data was from 2014 EEO-1 reports with the exception of Yahoo (2013). Several of the tech companies have publicly stated that they their workforce doesn't fit neatly into the categories that the EEO-1 report requires and have given their own breakdown of employees showing tech vs. non-tech, and leadership (by their own definition). While the companies’ self-reported breakdowns may provide a more accurate picture of a particular company, the differences in classification methods from one company to the next makes it difficult to aggregate or compare the data meaningfully, so I used the standardized classifications that the government requests. Note that the EEO-1 figures do not separate out foreign nationals working in the U.S., whereas earlier steps in the pipeline count U.S. residents only.
Other helpful sources
I consulted with several people with relevant experience whose perspectives influenced my approach. I am grateful for their valuable input.
Sarah Nahm, Founder and CEO of Lever, a company that works with tech companies in the hiring process. Lever's website
Jane Margolis, UCLA professor and author of Stuck in the Shallow End: Education, Race, and Computing
Caroline Simard, Director of Research at Stanford University, focused on building better workplaces for women.
Christopher Palmer, Economist at UC Berkeley
I consulted with Dr. Palmer regarding data sources and validity of overall interpretations.
Winnie King at Google Global Communications & Public Affairs sent these links for reference:
https://www.google.com/edu/resources/computerscience/research/
http://g.co/csedu
http://googleforeducation.blogspot.com/2015/08/searching-for-computer-science-google.html
http://services.google.com/fh/files/misc/searching-for-computer-science_recommendations.pdf
The print article in Wired's November issue